A Call to Action for Public Health Care
The objective of this investigation is to mine actionable findings from a JSON file provided by the National Center for Health Statistics.

Objective
A JSON file can be an extremely useful tool to easily store information in an organized, easy-to-acess manner. With the basics of data mining, users can retrieve actionable findings from any JSON file. In this notebook, I have chosen to mine a JSON file provided by the National Center for Health Statistics. This file presents data on the 10 leading causes of death in the United States beginning in 1999. This includes data on mortality statistics, age-adjusted death rate, cause of death, and demographic. “Data are based on information from all resident death certificates filed in the 50 states and the District of Columbia using demographic and medical characteristics.”
With this file, there is a lot to learn. In addition to data mining, I ultimately decided to drive my investigation with the following questions:
- What is the leading cause of death within the United States?
- Can we examine a trend in death rates? Say in suicide, for example.
- Is it possible to examine mortality statistics by demographic?
Data Mining
To begin, I important the library required to parse my JSON file. I then open, read, and close the file.
# Import library
import json

# Open json file
myfile = open("LeadingCausesofDeathUnitedStates.json", "r")

# Read in file
parsed = json.load(myfile)
# Close file
myfile.close()
I am interested in the data type of parsed. We know now that it is of type dictionary:
# Print type
print(type(parsed))
 Data type of parsed
I am interested in the total length of the dictionary. This would tell me the number of items in the dictionary. From the output, we know that it has 2 items.
# Print length of dictionary
len(parsed)
 Length of parsed
We know that a dictionary in Python is an unordered collection of data values. But unlike other data types that hold only a single value as an element, a dictionary holds a key : value pair as an element. Because the length of my dictionary is 2, I am expecting only 2 keys. We can use .key() method to return a list of all keys in the dictionary:
# Print keys of dictionary
parsed.keys()
 parsed keys
meta Key
The output above returns 2 keys as expected. Let’s dig into the meta key to learn a little more about it. First, I learn its data type is also a dictionary:
type(parsed['meta'])
 Data type of meta
Let’s go ahead and print the keys:
# Keys of meta
parsed['meta'].keys()
 meta keys
meta only has one key. Let’s see what its data type is:
# Type of view
type(parsed['meta']['view'])
 Data type of view
view is also a dictionary. Before we go any further lets print its keys:
# Keys of view
parsed['meta']['view'].keys()
 view keys
The print out above tells us that meta gives us a little more information about the data structure and modifications of our JSON file. Though this information could be particularly useful, I am more interested in the data itself. Lets dig more into the data key instead.
data Key
First I learn that data is a list as opposed to a dictionary:
type(parsed['data'])
 Data type of data
It is safe to assume that data is a list containing the data records. Lets see how many data records we have by printing the length of data:
# Length of data
len(parsed['data'])
 Length of data
The print out above tells us we’re handling 10,868 observations. Lets see what the first observation looks like:
parsed['data'][0]
 First record
The first observation gives us a range of information. The only information we’re interested in however is the Year, 113 Cause Name, Cause Name, State, Deaths, and Age-adjusted Death Rate. In this case, we’ll subset each observation so that it returns the last 6 elements within its list:
# Last 6 elements of the first observation
parsed['data'][0][-6:]
 First record
Above I subset just the first element. Below I use a for loop to subset all observations and store it in data :
# Subset all observations and store in data
data = []

for i in range(0,10868):
    data.append(parsed['data'][i][-6:])
I want to get a list of unique values for year. To do so, I use a for loop to run through each of my observations and retrieve the first element, representing the year. I then utilize set() and .sort() to retrieve a sorted list with unique values for year. We now know that our data ranges from 1999 - 2017.
# Get unique values for year
year = []

for i in range(0,10868):
    year.append(data[i][0])

unique_year = list(set(year))
unique_year.sort()

', '.join(unique_year)
 Years
Years
Similarly, I want to get a list of unique values for state. Following the same procedure with the fourth element of each observation, I retrieve a sorted list with unique values for state. Interestingly enough, the United States is included within the list.
# Get unique values for state
state = []

for i in range(0,10868):
    state.append(data[i][3])

unique_state = list(set(state))
unique_state.sort()

', '.join(unique_state)
 States
Similarly, I want to get a list of unique values for cause name. Following the same procedure with the third element of each observation, I retrieve a sorted list with unique values for cause name:
# Get unique values for Cause Name
accident = []

for i in range(0,10868):
    accident.append(data[i][2])

unique_acc = list(set(accident))
unique_acc.sort()

', '.join(unique_acc)
 Cause names
I am not interested in All causes so I use .remove() to remove the element from my list unique_acc:
# Remove 'All causes'
unique_acc.remove('All causes')
', '.join(unique_acc)
 Cause names
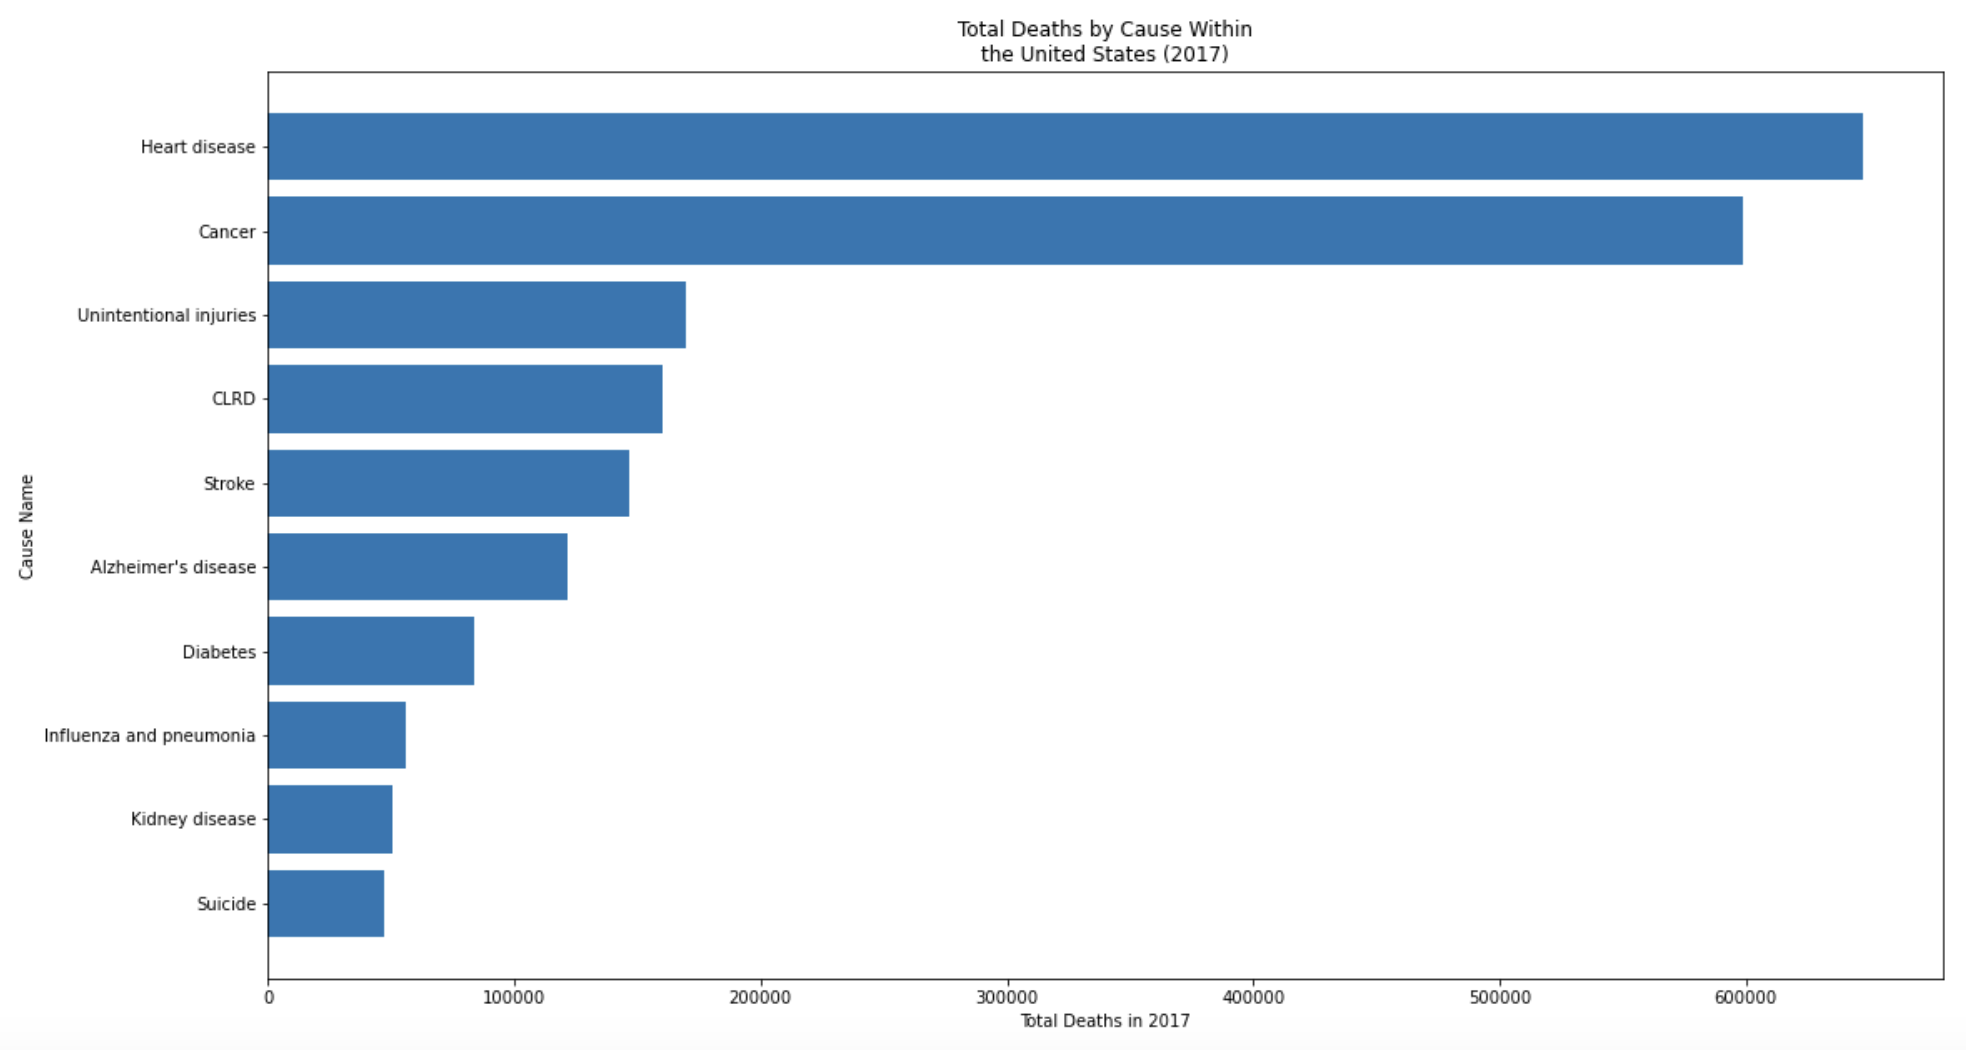
Next, I want to address my first research question, What is the leading cause of death within the United States? I decided that I want to make a general function that takes in two parameters, the year and state, so that it returns a bar plot with the mortality statistics for each of the leading causes. From the plot, we should then be able to identify the leading cause of death within any demographic. Within my function, I subset the data so that I only have records for the specified year and state. I then create a horizontal bar graph with the total deaths for each of the leading causes.
def yearly_report(year, state):
    records = []

    for i in data:
        if (i[0] == str(year)) & (i[3] == str(state)):
            records.append(i)

    total_deaths = []

    for i in unique_acc:
        for j in records:
            if j[2] == i:
                total_deaths.append(int(j[4]))

    bar_data = {unique_acc[i] : total_deaths[i] for i in range(0, len(total_deaths))}
    sorted_bar_data = {}
    keys = sorted(bar_data, key=bar_data.get, reverse=False)
    for i in keys:
        sorted_bar_data[i] = bar_data[i]

    fig = plt.figure(figsize =(18, 10))
    plt.barh(list(sorted_bar_data.keys()), list(sorted_bar_data.values()), align='center')
    plt.xlabel(("Total Deaths in " + str(year)))
    plt.ylabel('Cause Name')
    plt.title(('Total Deaths by Cause Within\nthe ' + str(state) + " (" + str(year) + ")"))
    plt.show()
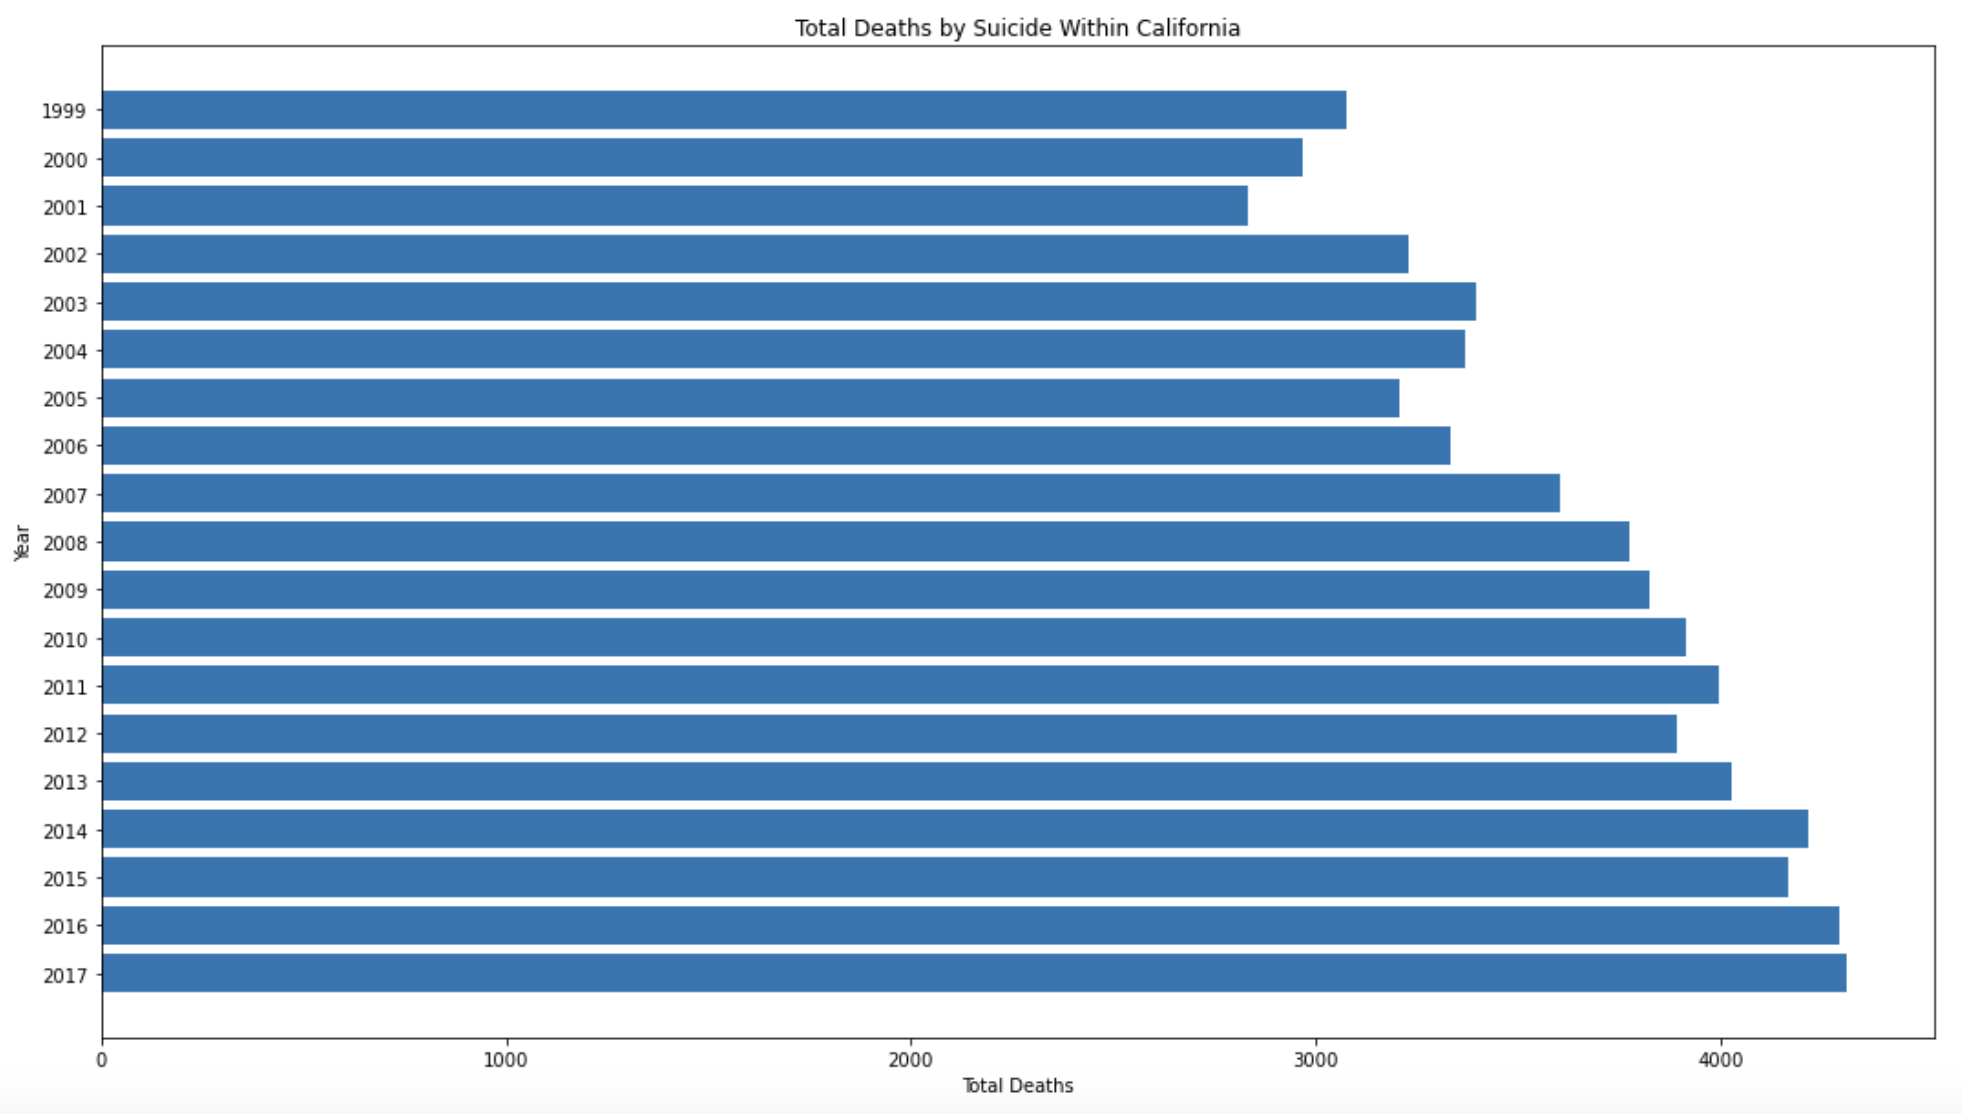
Next, I want to address my second research question, Can we examine a trend in death rates? I decided that I want to make a general function that takes in two parameters, the cause and state, so that it returns a bar plot with the yearly mortality statistics for the specified cause in the specified demographic. From the plot, we should then be able to identify if there exists a trend in the cause of interest. Within my function, I subset the data so that I only have records for the specified cause and state. I then create a horizontal bar graph with the total deaths for each year.
def trend_report(cause, state):
    records = []

    for i in data:
        if (i[2] == str(cause)) & (i[3] == str(state)):
            records.append(i)

    total_deaths = []
    all_years = []

    for i in records:
        total_deaths.append(int(i[4]))
        all_years.append(i[0])

    fig = plt.figure(figsize =(18, 10))

    plt.barh(all_years, total_deaths, align='center')
    plt.xlabel("Total Deaths")
    plt.ylabel('Year')
    plt.title(('Total Deaths by Suicide Within ' + str(state)))
    plt.show()
Findings
What is the leading cause of death within the United States?
Using my defined function, we can finally answer my first research question. The plot below provides us with a visualization of the mortality rates for the 10 leading causes of death in the United States from 2017. We can conclude that heart disease has claimed the first spot as the leading cause of death in the United States, closely followed by cancer.
yearly_report(2017, "United States")
 2017 Yearly Report (U.S.)
Can we examine a trend in death rates?
Using another defined question, we can go ahead an answer my second research question. I decided I wanted to investigate whether there exists a trend in suicide rates within the state of California. The plot below reveals a steady increase in suicide deaths within the state of California. To answer my research question, yes we can use the JSON file to examine a trend in death rates. In fact, my defined function enables us to examine trends either by cause or state as long as we specify.
trend_report('Suicide', 'California')
 Suicide Trend Report (CA)
Recommendations
National and state mortality data are important because it can help us better understand how many people are dying and, more importantly, why. With this data, we can reveal trends and emerging challenges (for example, COVID-19), track the effectiveness of interventions (for example, vaccine distributions), and help public health officials make decisions that could potentially improve and save lives.
The JSON file provided by the National Center for Health Statistics captures all death records from across every state in the United States. For my investigation, I decided to parse through this JSON file to identify the leading causes of death within the nation, as well as identify any potential trends. With a user defined function, I concluded that heart disease is the leading cause of death within the United States. I also identified an increasing trend in suicide deaths within the state of California. With this information, public health officials should respond with the right treatment and interventions to prevent any further deaths from occuring.
It is important to note, however, that my defined functions yearly_report and trend_report enables users to define their desired records. Using yearly_report, for example, I could decide to view the leading causes of death within the state of Texas from 2000 by simply specifying. So, answering my third research question, Is it possible to examine mortality statistics by demographic?, yes we can. This capability can be extremely useful for researchers, clinicians, policymakers, and many others. With this capability, national and state public health officials can easily identify public health issues by demographic so that they can come up with a rapid respose that could potentially save lives.
The source code is available here.


